Most advice on how to measure campaign success is built around the wrong scoreboard. It tells you to watch clicks, impressions, engagement rate, and platform-reported conversions, then decide whether the campaign worked. That's fine if your job is to optimize a dashboard. It's useless if your job is to protect budget and prove business impact.
A campaign can look strong inside Meta Ads, Google Ads, or LinkedIn and still fail where it matters. It can also look weak in last-click reporting while indirectly driving branded search, direct visits, return sessions, and pipeline that shows up somewhere else. That gap is where a lot of bad decisions get made.
The practical standard is simpler than the reporting usually makes it seem. Start with the business outcome. Decide what counts as success before launch. Track the campaign cleanly. Use attribution with humility. Then check whether the campaign created revenue or customer value that would not have happened otherwise.
Table of Contents
- Moving Beyond Clicks and Impressions
- Define Your Campaign's North Star Goal
- Choose Your Measurement Toolkit and Attribution Model
- Instrument Tracking Before You Go Live
- Analyze Results and Calculate True Business Impact
- Create Repeatable Reports and Iterate for Growth
Moving Beyond Clicks and Impressions
The first mistake in campaign measurement is treating platform metrics as business metrics. Clicks tell you whether someone interacted. Impressions tell you whether an ad was delivered. Neither tells you whether the campaign created profitable demand.
That becomes obvious when you look at spillover revenue. Much of a campaign's impact doesn't arrive through the clicked ad path at all. It shows up later in branded search, direct traffic, organic visits, or a buyer returning from another device. According to Prescient AI's write-up on spillover revenue and attribution, 30–50% of true campaign impact often occurs in untracked channels, and brands using data-driven attribution models that capture these effects see 22% higher accurate ROI reporting than brands relying on last-click models.
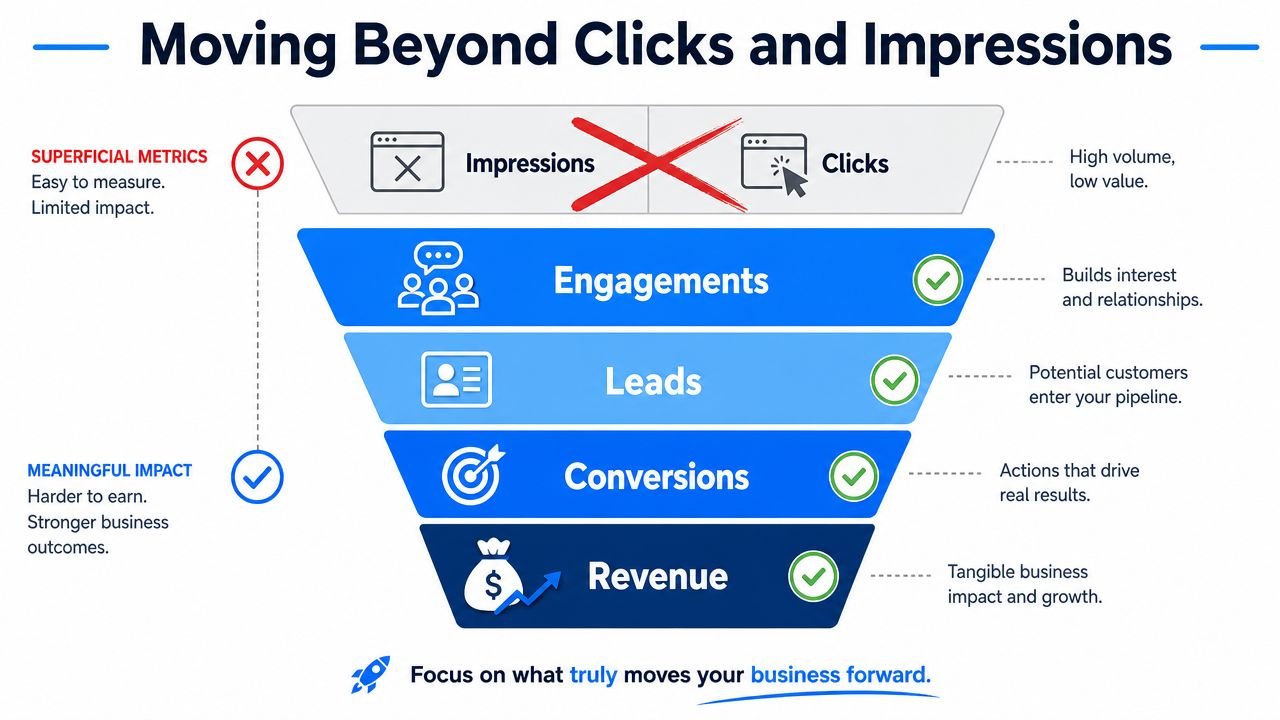
In practice, this is why a paid social campaign can “underperform” in the ad account while branded search and direct conversions climb. The campaign introduced demand. Another channel harvested it. If you only measure the harvest channel, you'll under-credit the source channel and cut budget in the wrong place.
What dashboards miss
SaaS teams run into this constantly with demand generation. A prospect sees a founder video on LinkedIn, ignores the post, searches the company name two days later, reads comparison content, joins a demo, and closes after sales follow-up. An eCommerce shopper might see a product bundle ad on Instagram, not click, then type the brand into Google later that night and purchase through a branded search ad.
That's why I treat platform dashboards as diagnostic tools, not verdicts.
Practical rule: If a channel creates attention upstream, don't evaluate it only on the last touch downstream.
A more grounded way to think about performance is to ask whether the campaign improved the business signals that matter. Did branded demand rise? Did qualified leads improve? Did new customer revenue move? Did the campaign increase the brand's search visibility across the queries buyers actually use?
What to stop doing
A few habits create bad measurement fast:
- Judging channels in isolation: Meta, Google, LinkedIn, email, SEO, and influencer activity affect each other.
- Trusting only click-path conversions: Many buyers don't convert on the first visit or first device.
- Calling attention success a revenue success: Reach can matter, but it isn't the finish line.
- Ignoring branded and direct response: Those channels often capture demand generated elsewhere.
If you remember one thing, make it this. The question isn't “what did the ad platform report?” It's “what changed in the business because the campaign ran?”
Define Your Campaign's North Star Goal
Bad measurement usually starts before the campaign launches. Teams say they want “awareness,” “engagement,” or “more traffic,” then spend the rest of the campaign debating what success means. That's avoidable.
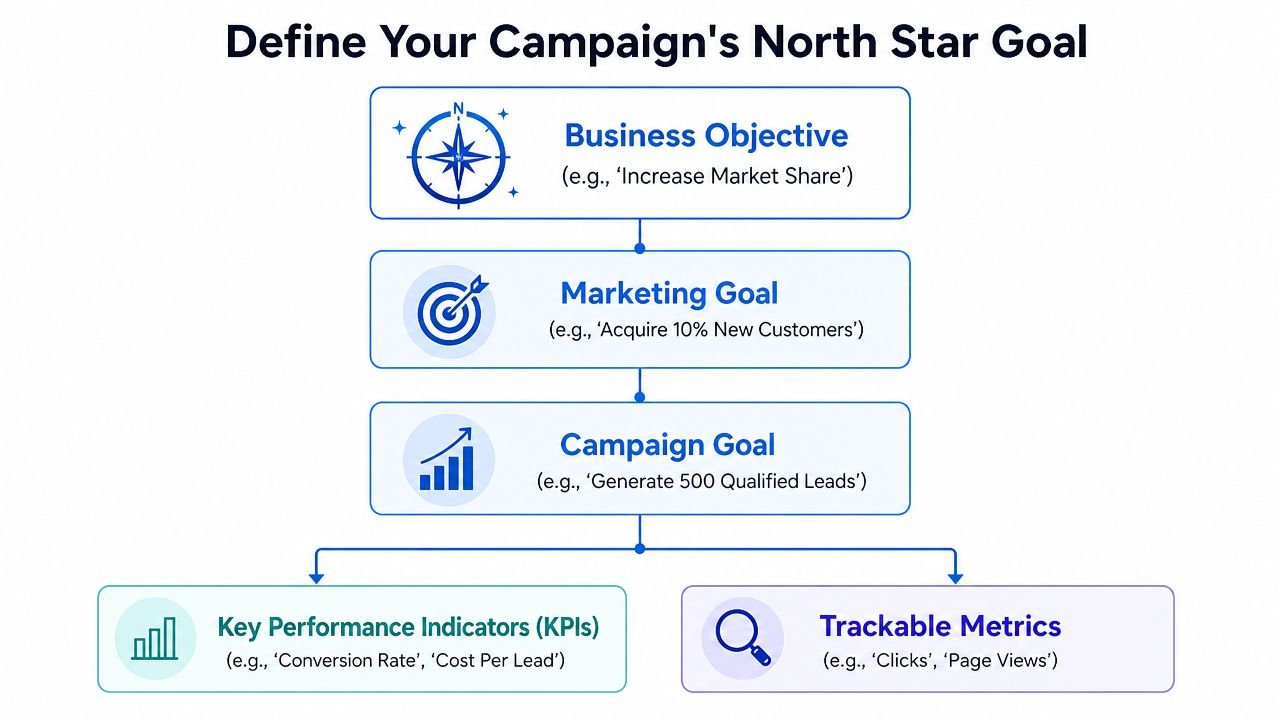
You need a North Star goal stated in business terms. Not a list of metrics. Not a vague outcome. A clear result that determines whether the campaign deserves more budget.
Pick one outcome that matters
A practical framework is the three-tier KPI structure. According to Salesgenie's guide to measuring campaign ROI, teams should limit primary metrics to no more than two Tier 1 business outcomes, such as revenue, retention, or efficiency, and cross-reference platform data with CRM revenue data because gaps often reveal that a campaign is converting existing customers rather than bringing in new ones.
For most campaigns, one Tier 1 metric is even better than two.
In SaaS, strong North Star examples include:
- Net new pipeline from target accounts
- New customer revenue from a launch campaign
- Sales-qualified demo volume from a category page push
- Expansion revenue from a customer education campaign
In eCommerce, stronger North Star examples look like this:
- New customer revenue from paid social
- Blended customer acquisition efficiency
- Revenue from a product launch
- Repeat purchase rate from post-purchase email
Weak goals sound like “increase traffic,” “improve engagement,” or “generate buzz.” Those can support the goal. They shouldn't be the goal.
Build supporting KPIs underneath it
Once the main outcome is fixed, add supporting measures that explain movement without replacing the main outcome.
A simple structure works well:
| KPI tier | What it should track | Example in SaaS | Example in eCommerce |
|---|---|---|---|
| Tier 1 | Business outcome | New customer revenue | New customer revenue |
| Tier 2 | Performance drivers | Demo request rate, lead quality | Conversion rate, add-to-cart rate |
| Tier 3 | Tactical diagnostics | CTR, landing page bounce patterns | CTR, creative engagement |
Many teams overload the dashboard. They track everything because they can, then give all metrics equal weight. That creates confusion at exactly the moment the team needs clarity.
The cleanest reporting stack is often the most useful one. One business outcome, a few drivers, and a handful of tactical diagnostics.
A good test is this. If the metric improves, would you spend more money with confidence? If the answer is no, it probably isn't a primary KPI.
For example, if a SaaS content promotion campaign is distributing a new asset across content distribution channels that match buyer intent, the North Star shouldn't be downloads alone. It should be something downstream, like qualified pipeline influence or new opportunity creation. Downloads matter only if they help predict that result.
That discipline is what makes how to measure campaign success manageable. Otherwise you're just collecting numbers and arguing over interpretation.
Choose Your Measurement Toolkit and Attribution Model
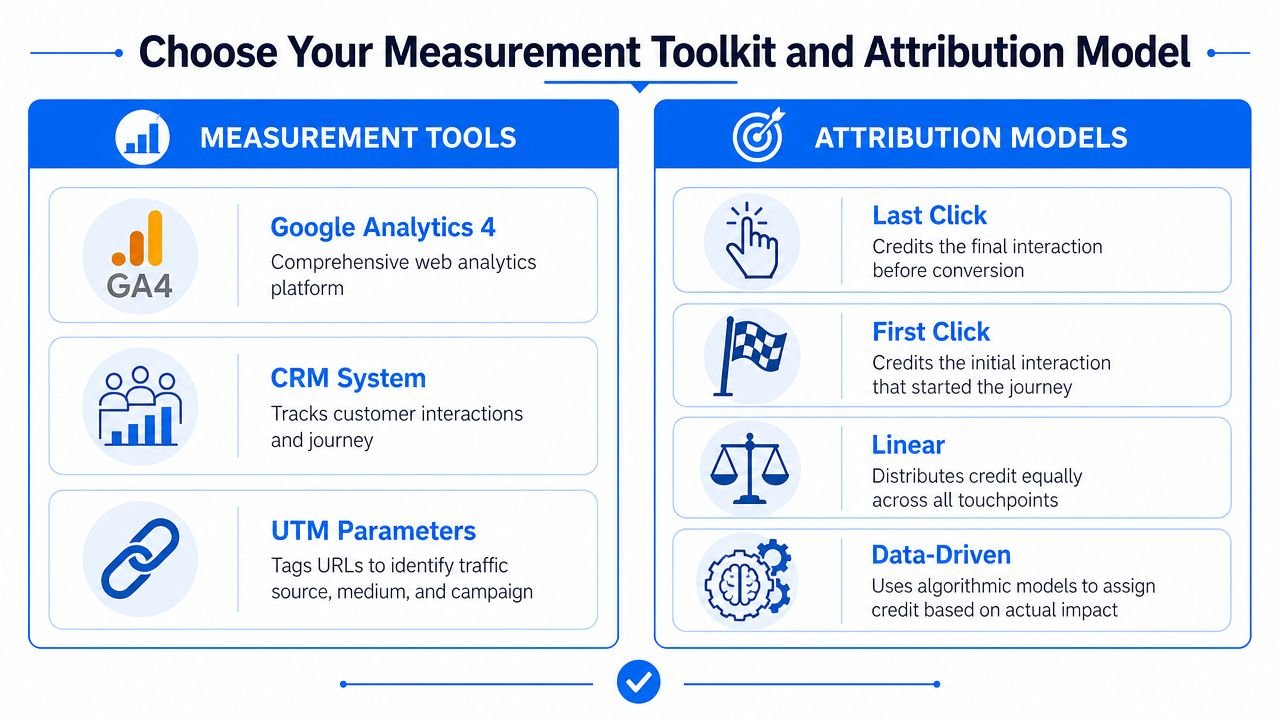
Once the goal is clear, the stack comes next. You don't need a bloated toolset. You need a setup that can answer three questions cleanly: where the visitor came from, what they did, and whether the activity turned into revenue.
Start with tracking fundamentals
A foundational shift in campaign measurement came from the adoption of UTM parameters, which made it possible to identify traffic source and medium directly in campaign URLs. DemandScience's overview of campaign measurement also describes a modern three-layer pyramid measurement system made up of executive metrics such as revenue impact and CAC, operational campaign metrics, and tactical platform-specific metrics.
That structure maps cleanly to a practical toolkit:
- Google Analytics 4: Useful for on-site behavior, conversion events, pathing, and channel comparisons.
- CRM platform: HubSpot, Salesforce, Pipedrive, or another system that ties leads and customers to revenue.
- Ad platforms: Google Ads, Meta Ads, LinkedIn Campaign Manager, TikTok Ads, and others for tactical optimization.
- UTM governance: A naming system that keeps campaign, source, medium, and content fields consistent.
If one of those pieces is missing, the campaign becomes harder to evaluate. If the CRM is missing, you can see leads but not revenue. If UTMs are messy, channel reports become unreliable. If analytics events are broken, conversions disappear or double count.
Compare attribution models like an operator
Attribution models are useful. They're also easy to misuse. The problem isn't that a model exists. The problem is pretending any model is objective truth.
Here's the short version.
| Model | What it does | Good use case | Main weakness |
|---|---|---|---|
| First-click | Gives credit to the first touch | Measuring top-of-funnel demand creation | Overstates introduction and ignores closing influence |
| Last-click | Gives credit to the final touch | Simple reporting for short buying cycles | Under-credits channels that create demand earlier |
| Linear | Splits credit across touchpoints | Multi-touch journeys with several meaningful interactions | Treats weak and strong touches too similarly |
| Data-driven | Uses modeled contribution based on observed patterns | Mature programs with enough data and complexity | Still a model, not proof of causation |
For early-stage teams, I'd keep it practical. Use clear UTMs, choose one attribution approach before launch, and make the CRM the source of truth for revenue. Use platform reporting to optimize creative, audience, and placement decisions. Don't use it as the final word on ROI.
A few working rules help:
- Agree before launch: If the team debates attribution after the campaign, the argument is usually political, not analytical.
- Use one reporting view for decision-making: Multiple views are fine for analysis, but one should drive the budget decision.
- Check platform numbers against CRM outcomes: If ad platforms claim wins that the CRM can't validate, trust the revenue system.
- Treat multi-touch as directional: It explains contribution patterns. It doesn't prove causation.
If you need one sentence to align a team, use this one: attribution helps explain the journey, but revenue data decides the outcome.
Instrument Tracking Before You Go Live
Most measurement problems don't come from weak analysis. They come from sloppy setup. The campaign launches, traffic arrives, and then someone notices the primary conversion never fired, the UTMs are inconsistent, or paid traffic is landing on pages without the right event tracking.
That's expensive because you can't recover data you never collected.
Use a pre-launch checklist
Before any budget goes live, verify the mechanics. Not in theory. In the actual environment where the campaign will run.
A tight checklist should include:
Primary conversion events are defined
Know the exact action that counts. For SaaS, that might be a booked demo, activated trial, qualified lead status, or closed-won revenue in the CRM. For eCommerce, it may be purchase, first purchase, subscription start, or repeat order.
Analytics events fire correctly
Test forms, checkout flows, demo schedulers, and button-based conversions in Google Analytics 4. Confirm the event triggers once and carries the right parameters.
Ad platform pixels are present
Meta Pixel, Google Ads tags, LinkedIn Insight Tag, and other platform scripts should be verified on the right pages and key conversion steps. A pixel installed sitewide but missing from checkout or confirmation pages causes misleading reports.
UTM structure is standardized
Lock down source, medium, campaign, content, and term naming before launch. “Paid-social,” “paidsocial,” and “social-paid” are not harmless variations. They fragment reporting.
Standardize naming before the team scales spend
The simplest naming systems usually last the longest. Use a convention the whole team can follow without a meeting every week.
For example:
- Source: google, meta, linkedin, newsletter, partner
- Medium: cpc, paid-social, email, referral
- Campaign: spring-launch, q3-demo-promo, black-friday-bundles
- Content: video-hook-a, founder-post-1, carousel-benefit-3
Then make two things essential.
- Every outbound campaign link gets tagged
- Everyone uses the same approved values
I also recommend checking lead flow end to end. Submit a test form. Make a test purchase if possible. Confirm that the session source passes through analytics, the lead or order appears in the CRM or commerce platform, and the campaign fields remain readable.
Broken instrumentation creates false certainty. The dashboard still fills up. The numbers just stop meaning what you think they mean.
If you want clean answers later, you secure them at this stage.
Analyze Results and Calculate True Business Impact
Once the campaign is live and enough data has accumulated, reporting starts. At this point, many teams drift back into surface metrics because they're easier to pull. Resist that. The point isn't to list everything that happened. The point is to decide whether the campaign was worth the spend.
Separate reporting metrics from decision metrics
I split campaign analysis into two buckets.
Reporting metrics help explain what happened:
- CTR
- Landing page conversion rate
- Cost per click
- Add-to-cart rate
- Demo request rate
- Lead quality indicators
Decision metrics decide whether to keep, cut, or scale:
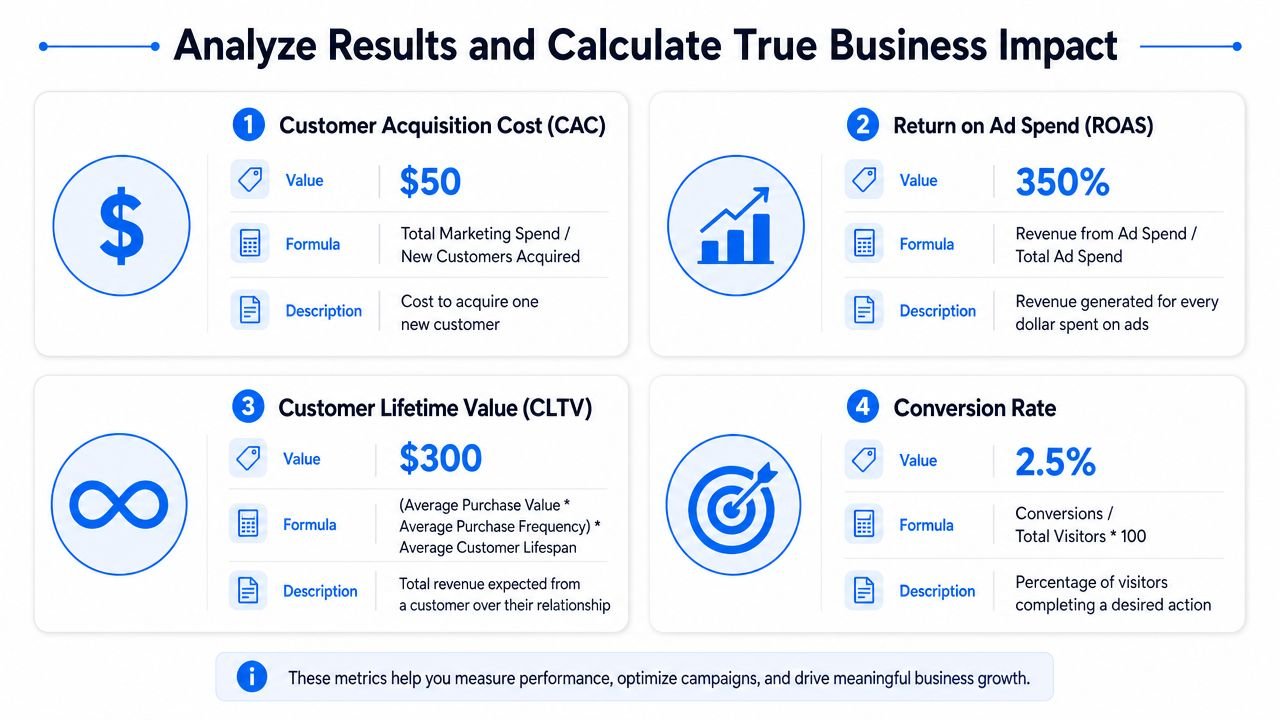
- Customer acquisition cost
- Revenue
- New customer revenue
- Return on ad spend
- ROI
- Retention or payback-related outcomes
That distinction matters because reporting metrics can improve while business performance gets worse. A lower cost per click doesn't help if those clicks don't become customers. A better click-through rate doesn't help if you attracted the wrong audience.
For SEO, content promotion, and organic acquisition in particular, this is why teams often end up revisiting how to measure SEO ROI in business terms instead of channel vanity metrics. The same logic applies to paid and lifecycle campaigns.
Measure incrementality, not just observed revenue
The strongest metric for campaign success in many B2C and B2B settings is incremental revenue. Analytical Alley's explanation of campaign success metrics describes it as the additional revenue directly attributable to marketing activity, measured by comparing actual sales against a counterfactual forecast of what would have happened without the campaign. That framework relies on Marketing Mix Modeling, using granular inputs such as media spend by channel, production costs, agency fees, and transaction-level sales data.
Revenue that happened during the campaign isn't automatically revenue caused by the campaign.
A simple example:
| Scenario | Surface reading | Better reading |
|---|---|---|
| Branded search conversions rise during a paid social push | Search looks like the winner | Social may have created the demand |
| Traffic spikes during a product launch | The campaign looks successful | Some of the lift may have happened anyway due to seasonality or brand momentum |
| Retargeting closes a large share of purchases | Retargeting gets the credit | Prospecting and content may have done the harder work earlier |
That's the difference between correlation and causation. A campaign can coincide with revenue without driving it. It can also drive revenue that another channel appears to capture.
The useful question isn't “how much revenue happened?” It's “how much additional revenue happened because this campaign existed?”
For larger programs, geo holdout testing is one of the cleanest ways to estimate lift. A separated market runs with reduced or no campaign pressure, and the difference between exposed and holdout markets helps isolate impact. This works only if the baseline is reconstructed carefully and the markets have enough volume to produce a readable signal.
Respect lag before you judge performance
B2B teams often get burned. They launch a campaign, watch week-one CTR and conversion trends, then cut spend before the sales cycle has time to mature.
According to Harvest Moon Marketing's guide to measuring campaign success with baseline reconstruction and lag windows, the evaluation period can range from 14 days to 14 months depending on the sales cycle, and up to 40% of B2B campaigns are incorrectly terminated before their true revenue impact materializes because they're judged too early.
That doesn't mean you ignore early data. It means you classify it correctly.
- Early stage: Watch diagnostics like CTR, viewability, and lead flow to catch setup or targeting problems.
- Middle stage: Look for movement in qualified actions, lead quality, and assisted conversions.
- Later stage: Judge revenue, payback, pipeline quality, and incremental lift after enough lag has passed.
A SaaS campaign aimed at enterprise buyers might need months before closed revenue tells the truth. An eCommerce flash promotion may reveal enough much faster. Different motion, different window.
If you want a durable answer to how to measure campaign success, this is it. Match the metric to the decision, and match the decision to the timeline reality of the buying cycle.
Create Repeatable Reports and Iterate for Growth
The last piece is operational. One smart post-campaign review won't change much if the next campaign starts from scratch. What compounds is a reporting rhythm that gives executives a clean business readout and gives marketers enough detail to improve the next launch.
Build two views of the same campaign
One dashboard should not try to serve every audience equally. That's how you get cluttered reports that nobody trusts.
Build two layers instead:
Executive view
- North Star outcome
- Spend
- Revenue or pipeline influenced
- New customer impact
- Efficiency metric such as CAC or ROI
- Brief commentary on what changed and what decision follows
Operator view
- Channel and campaign breakdowns
- Creative-level diagnostics
- Landing page behavior
- Audience or segment performance
- Funnel leakage points
- Attribution comparisons against CRM outcomes
A simple tool like Looker Studio can work if the underlying data is clean. So can a spreadsheet-backed reporting pack for smaller teams. The format matters less than consistency.
Turn each campaign into the next test
The main benefit of reporting is not documentation. It's better allocation.
After each campaign, answer a short set of questions:
- What result mattered?
- Which leading indicators predicted that result well?
- Which metrics were noisy or misleading?
- Where did attribution under-credit or over-credit a channel?
- What should change before the next launch?
In this context, teams sharpen judgment. Over time, they learn which early signals deserve trust, which channels create spillover, which campaigns need longer windows, and which dashboard metrics are just decoration.
Good reporting closes the loop between spend, learning, and the next decision.
That loop is what turns campaign measurement from a retrospective exercise into a growth system. You stop asking whether marketing is working in the abstract. You start asking which inputs produce better business outcomes, under what conditions, and with what trade-offs.
That's a much more useful question. It's also the one that helps teams spend with confidence.
If you want a team that cares about measurement the same way it cares about execution, SaasSky is worth a look. They work with SaaS and eCommerce brands on link building with a clear focus on accountability, transparent planning, and measurable impact.