You open Google Search Console, click the Core Web Vitals report, and see the same pattern many SaaS and eCommerce teams see. Important URLs are stuck in Needs Improvement or Poor, engineering is already busy, and every recommendation online seems to treat all metrics as equally urgent.
That's usually the wrong way to approach core web vitals optimization.
For transactional pages, not all failures cost you the same. A SaaS homepage with a slow hero, a pricing page that takes too long to render, or a product page where the main image appears late will usually suffer more from weak loading performance than from a small visual shift that users barely notice. That doesn't mean CLS and INP don't matter. It means you need an order of operations.
The playbook below is the one performance-minded teams use when rankings and conversions both matter. Fix the bottleneck that blocks perception first. Then protect responsiveness and stability without introducing regressions.
Table of Contents
- Why Core Web Vitals Matter for SaaS and eCommerce
- Your Core Web Vitals Measurement and Diagnosis Toolkit
- The LCP Optimization Playbook for Transactional Sites
- Fixing INP and CLS Without Hurting Performance
- Setting Performance Budgets and Automating Monitoring
- Rolling Out Changes and Measuring SEO Impact
- Sample Playbooks and Key Takeaways
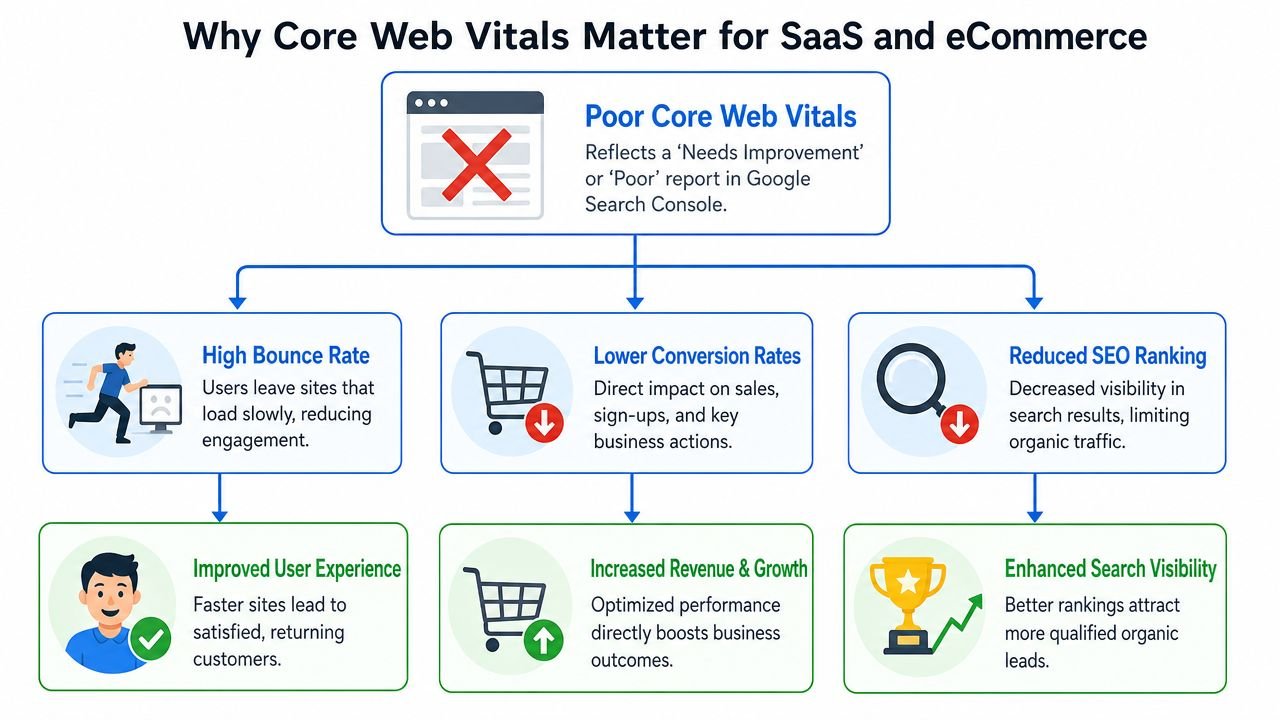
Why Core Web Vitals Matter for SaaS and eCommerce
A common failure pattern looks like this. The pricing page ranks, traffic lands, and the layout stays stable. But the hero copy, product image, or signup module appears too late, users hesitate, and conversion drops before the page has made its case.
That is why Core Web Vitals matter on SaaS and eCommerce pages. They shape both search performance and the first few seconds that decide whether a visitor keeps going.
For these businesses, the three metrics do not carry equal business weight. A slow LCP on a demo page, pricing page, category page, or product detail page usually costs more than a minor visual shift that happens after the main content is already visible. Teams that treat every metric as an equal priority often burn cycles on low-impact cleanup while the page still feels slow where it counts.
The three metrics and what they mean in practice
Here's the short version teams need:
| Metric | Good | Needs Improvement | Poor |
|---|---|---|---|
| LCP | under 2.5s | 2.5 to 4.0s | 4.0s or more |
| INP | 200ms or less | 200 to 500ms | above 500ms |
| CLS | below 0.1 | qualitative fail zone above good threshold | poor stability when shifts are high |
As noted earlier, Google evaluates these metrics against set thresholds and uses the 75th percentile of real-user experience. It also assesses mobile and desktop separately, which is why pages that seem acceptable on a developer machine can still underperform in production.
On transactional templates, each metric maps to a different failure mode:
- LCP affects arrival. Users need to see the primary headline, product image, pricing block, or signup prompt quickly.
- INP affects control. Filters, plan toggles, cart actions, and form fields need to respond without lag.
- CLS affects trust. Shifting buttons, jumping product cards, and moving checkout elements create avoidable friction.
Why LCP usually gets the first engineering sprint
A lot of general SEO blogs recommend distributing effort evenly across LCP, INP, and CLS. That sounds tidy. It is rarely how high-intent pages should be prioritized.
For SaaS and eCommerce, LCP usually has the clearest connection to revenue because it controls when the main value proposition becomes visible. If the above-the-fold product media, pricing content, or signup interface shows up late, users start evaluating the page late. Everything downstream gets weaker from that point, including engagement, conversion rate, and the page's ability to support search growth.
I have seen teams spend a sprint eliminating small shifts in below-the-fold modules while the hero image was still blocked by render-heavy JavaScript. The CLS score improved. Conversion did not. The page still felt slow during the moment that mattered most.
This does not mean INP and CLS are secondary forever. It means sequencing matters. Get the main content on screen fast, then remove interaction lag and layout instability without introducing heavy client-side fixes that slow delivery of the page. That balance is a big part of effective eCommerce SEO strategies for category and product pages.
Poor Core Web Vitals show up in rankings, but the business impact starts earlier. Users see a page that loads late, responds slowly, or shifts while they try to act. On transactional pages, that usually means fewer demos booked, fewer carts advanced, and less revenue from the traffic you already paid to get.
Your Core Web Vitals Measurement and Diagnosis Toolkit
A common failure pattern looks like this. The team runs Lighthouse on a fast laptop, sees a decent score, and closes the ticket. A few weeks later, Search Console still shows failing URLs, rankings stay flat, and the pages that should convert best still feel late on real phones.
That happens because diagnosis starts in the wrong place.
Lab tools are useful, but they simulate a page under controlled conditions. Core Web Vitals for search performance are judged from real-user behavior over time. On SaaS landing pages, pricing pages, and product detail pages, that distinction matters because the pages with the highest commercial intent often have the messiest mix of frontend code, third-party scripts, and conditional UI.
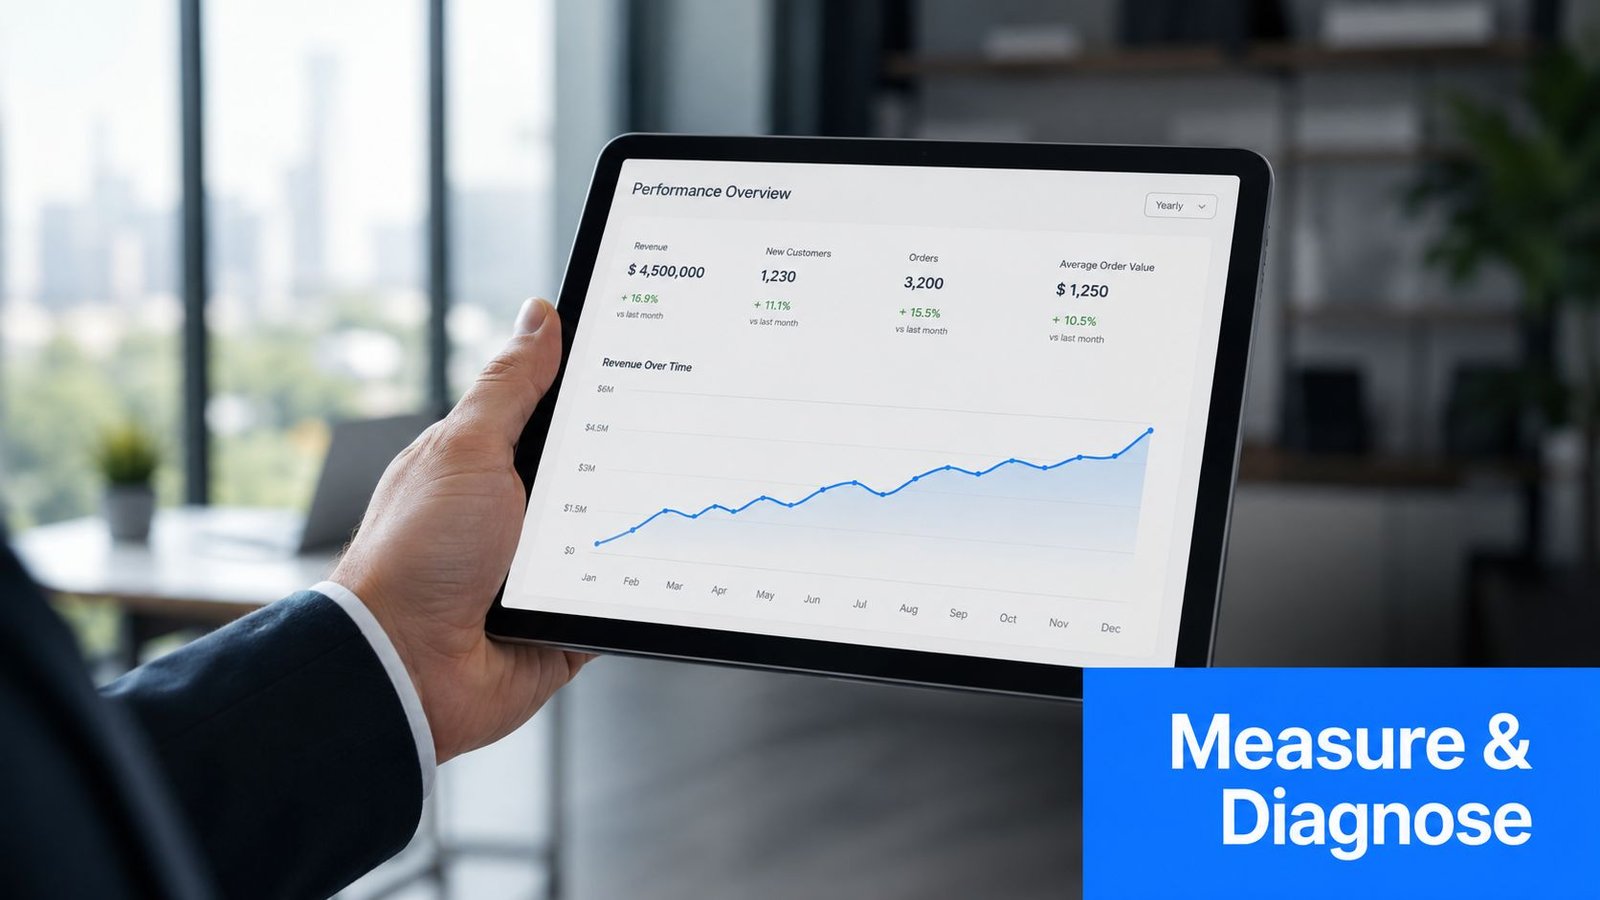
Start with field data, not opinions
Use field data to decide what deserves engineering time first.
If a template is failing in production, treat that as the source of truth even when a local Lighthouse run looks fine. Search Console and CrUX reflect what users experienced across devices, networks, and sessions. Lab data helps explain the failure. It does not cancel it.
For SaaS and eCommerce teams, this is also where prioritization gets sharper. A weak CLS score on a secondary module may be worth fixing later. A slow LCP on a signup page, pricing page, or product page usually goes first because it delays the moment users can evaluate the offer.
Practical rule: Use field data to set priority. Use lab tools to isolate the cause.
A practical three-layer workflow
Use Google Search Console for the macro view
Search Console shows which page groups are failing and which metric is driving the problem. That is enough to build an informed queue.
Review issues by template, not one URL at a time. Patterns usually show up fast:
- Homepage and landing pages often struggle with hero assets, font loading, and blocked rendering paths.
- Pricing pages often pick up INP or LCP issues from toggles, calculators, chat widgets, and testing scripts.
- Product detail pages often slow down because galleries, reviews, recommendations, and tracking tags all compete for bandwidth and main-thread time.
A broader website auditing checklist for technical and template-level reviews helps connect those symptoms to the systems behind them, including CMS decisions, deployment habits, and third-party dependencies.
Use PageSpeed Insights for the page-level story
After identifying the failing template, test representative URLs in PageSpeed Insights. Ignore the temptation to focus on the single score. The useful output is the combination of field data, lab diagnostics, and the waterfall clues behind them.
Look for cause-and-effect relationships:
- Poor LCP paired with slow initial response usually points to server latency, cache misses, or late resource discovery.
- Poor INP paired with heavy script execution usually points to long tasks, hydration cost, or too much work tied to a click or input.
- Poor CLS usually traces back to missing dimensions, injected banners, embeds, or components that render after layout is established.
This step is where teams often lose the plot by treating all three metrics as equal at all times. On transactional pages, that usually leads to low-impact cleanup while the main content still appears too late. Keep the diagnosis tied to business intent.
Use Chrome DevTools to find bottlenecks
DevTools is where the guesswork ends. Record the page load or the interaction that matters, then inspect what blocked the browser at the moment users felt the slowdown.
Check these views first:
- Network waterfall for slow HTML delivery, render-blocking CSS, and delayed discovery of the LCP asset
- Main thread activity for long JavaScript tasks, hydration work, and script execution spikes
- Rendering events for layout shifts, repeated style recalculation, and paint bursts
In React, Next.js, and JavaScript-heavy storefronts, the same pattern shows up often. The shell appears quickly, but the largest element waits on a client-side dependency, late CSS, or an image request with weak priority. Teams sometimes spend days reducing minor layout shifts while that bottleneck is still untouched. The scorecard may look cleaner. The page still feels slow where conversion starts.
What to document before you fix anything
Capture a baseline before changing code. This takes a few minutes and saves a lot of confusion later.
| What to log | Why it matters |
|---|---|
| Failing template groups | Stops random page-by-page fixes |
| Primary failing metric | Keeps the work tied to the main issue |
| Likely bottleneck | Speeds up implementation and review |
| Affected device type | Mobile failures often have different causes than desktop |
| Relevant third-party scripts | These are common sources of regressions |
Without a baseline, teams end up debating whether performance improved instead of verifying it.
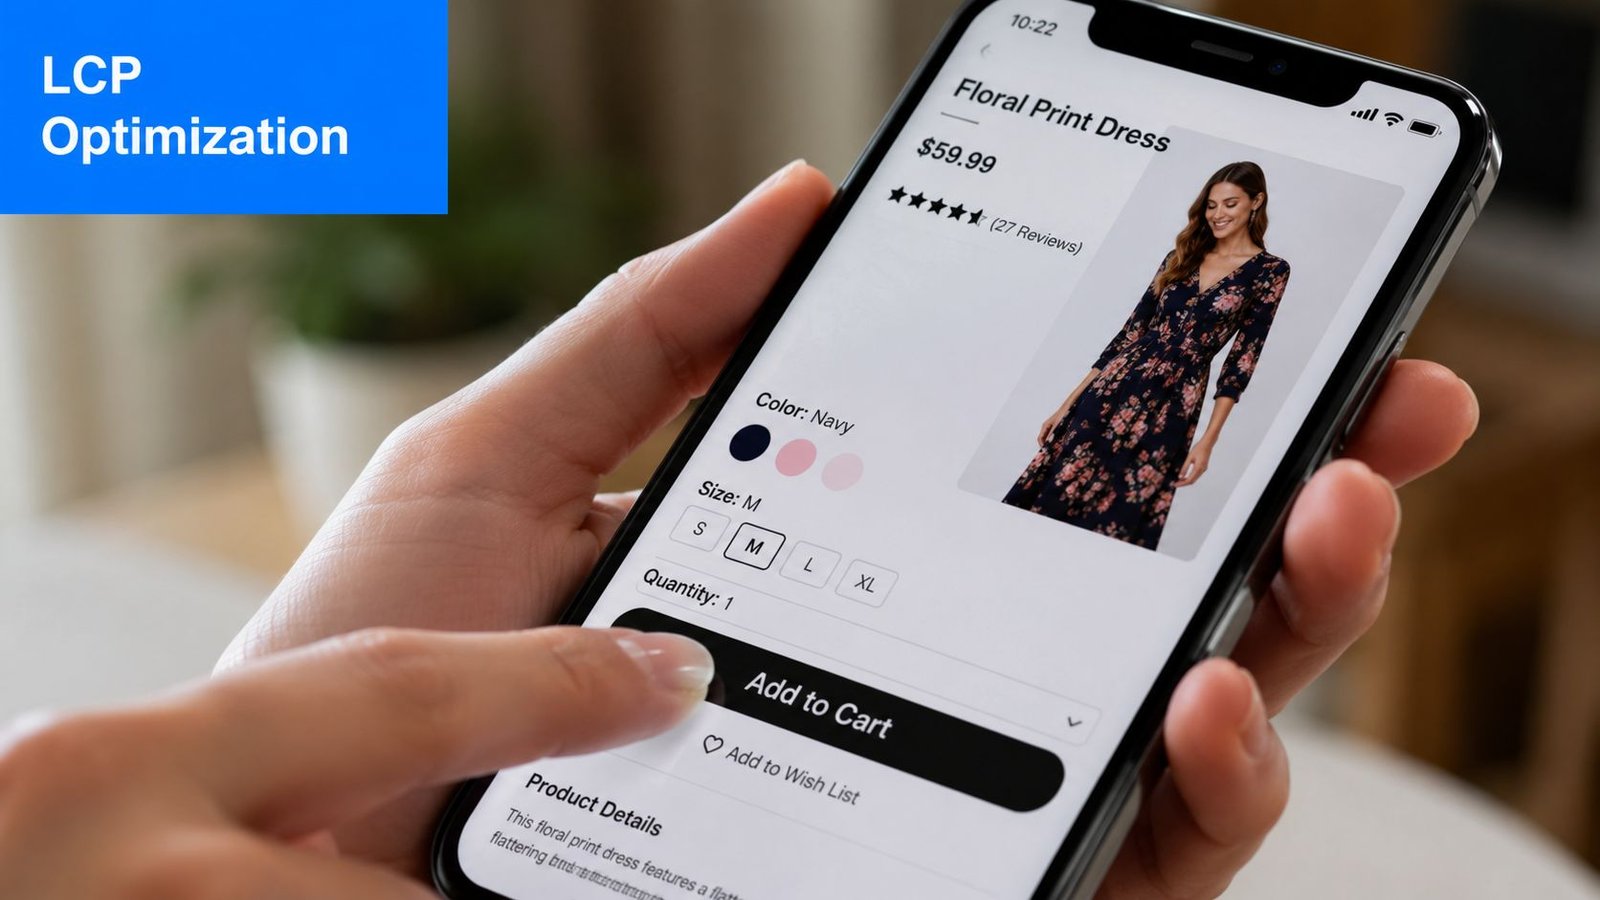
The LCP Optimization Playbook for Transactional Sites
A prospect lands on your pricing page from search, or a shopper opens a product page from Google Shopping. The browser starts working, but the headline, hero screenshot, or primary product image shows up late. That delay is where conversions slip. On transactional pages, LCP usually deserves attention first because the largest visible element is often the proof that the visitor is in the right place.
That priority matters because teams often over-correct for other metrics. They reserve every container, lazy-load every image, and clean up small layout shifts while the main content still arrives too late. The score distribution may improve. The page still feels slow at the exact moment a user decides whether to stay.
Win on the server before you tune the frontend
If the initial HTML is slow, the browser discovers everything else late. That means the LCP image request starts late, critical CSS applies late, and text that should anchor the page paints late. Frontend cleanup cannot fully offset that.
Start with the response path:
- Push HTML closer to users. Use a CDN for static assets and, where it makes sense, cache or serve HTML at the edge.
- Cache pages that do not need fresh computation on every request. Pricing pages, feature pages, and many product detail pages usually have more cache potential than teams assume.
- Reduce origin work on first load. Redirect chains, personalization middleware, session checks, and heavy server-side data fetching often hurt the pages that need to rank and convert.
- Keep the document small and early. The browser should get enough HTML to discover the hero, key copy, and critical styles quickly.
This is usually where the biggest LCP gains come from on SaaS sites with dynamic rendering and on storefronts with too much request-time logic.
Prioritize the hero, not the whole page
The browser only needs a few things early. It needs the asset or text block most likely to become LCP.
On SaaS pages, that is often the hero headline, product screenshot, UI mockup, or video poster. On eCommerce pages, it is usually the primary product image or the first gallery frame. Give that element priority before touching lower-value assets further down the page.
Changes that usually improve LCP
- Preload the actual LCP asset. Preloading the wrong image is common on responsive layouts and carousels.
- Prioritize critical CSS for above-the-fold content. The browser should not wait on a large stylesheet to paint the hero.
- Compress and resize hero media aggressively. Oversized screenshots and product images are still a routine source of slow LCP.
- Use modern image formats where browser support and visual quality make sense.
- Render key content on the server when client-side rendering delays the largest element. This matters on React-heavy product pages, pricing pages, and marketing routes built like app screens.
As noted in Google's own performance best-practices video, keeping total page weight and request count under control helps reduce blocking work. Those are useful guardrails when you set an LCP budget, but they are secondary to one question: did the browser get the LCP element early?
Avoid the lazy-loading trap above the fold
Aggressive lazy-loading often looks disciplined in code review and performs badly in the field.
If the hero image, product media, or primary screenshot is visible without scrolling, do not lazy-load it by default. That pattern can protect CLS while making LCP worse, which is the wrong trade on pages built to drive signups or purchases. For transactional templates, fast visual confirmation matters more than squeezing out a cleaner loading pattern on paper.
The safer pattern is simple. Reserve space for the media, load the above-the-fold asset immediately, and defer secondary visuals below the fold. For hero video, ship a poster first and delay playback logic until after the page is visually complete.
Common LCP bottlenecks by page type
| Page type | Most common LCP blocker | Better approach |
|---|---|---|
| SaaS homepage | Heavy hero video or JS-rendered hero | Server-render the hero, preload the poster or screenshot, delay playback code |
| Pricing page | Third-party widgets and delayed CSS | Strip non-essential scripts, prioritize pricing copy and plan cards |
| Product page | Large image gallery and recommendation blocks | Load the primary image first, defer gallery extras and recommendation modules |
What does not move the needle enough
Some cleanup work helps, but it rarely fixes LCP if the main bottleneck is discovery, priority, or server delay.
Watch for these patterns:
- Optimizing long-tail images first while the hero asset is still too large or starts too late
- Deferring scripts without checking render dependencies
- Spending sprint time on CLS-only fixes while the largest element still arrives late
- Keeping client-side rendering on pages that need fast first paint for SEO and conversion
- Preloading too many assets and diluting the priority of the one element that is critical
The best LCP work is selective. Identify the element users need to trust the page, make sure the browser can discover and paint it early, then strip away anything competing with it.
Fixing INP and CLS Without Hurting Performance
Once LCP is under control, the next job is to make sure the page stays responsive and stable. In doing so, teams often create regressions. They patch interaction lag by adding more code, or they fix layout shift with loading patterns that slow the initial render.
The goal is simpler than most checklists make it sound. Make interactions feel immediate. Keep the layout still. Don't sabotage the fast path you already created for LCP.
INP problems usually come from main-thread congestion
Interaction to Next Paint gets worse when the browser is busy doing too much at the wrong time. DebugBear's guidance is direct here. Optimizing INP requires breaking up long JavaScript tasks that exceed 50ms and reducing blocking work so interactions can respond within the target range, as outlined in DebugBear's Core Web Vitals documentation.
That points to a practical debugging pattern. Open Chrome DevTools, record a slow interaction, and look for long tasks around clicks, taps, filter changes, drawer opens, or form events.
Common INP offenders on SaaS and eCommerce pages
- Form validation that does too much on every keystroke
- Large hydration payloads on interactive components
- Filter and sort logic tied to expensive DOM updates
- Third-party scripts competing for the main thread
- Animation libraries attached to routine UI interactions
A lot of INP work is simply asking the page to do less per interaction.
Fix the interaction path, not the entire app
You don't need to rewrite the whole frontend to improve INP. You need to isolate the expensive path.
Try this sequence:
- Identify the specific interaction users perform most on the template.
- Record it in DevTools.
- Find the longest task around that interaction.
- Break that task into smaller units or defer non-essential work.
- Re-test the same interaction.
For example, a pricing toggle that triggers analytics, component re-rendering, layout measurement, and animation all in one event handler is usually doing too much. Split what's urgent from what can happen after paint.
If a click triggers business logic, visual updates, analytics, and DOM measurement in one burst, the browser will make the user wait.
The same goes for passive event listeners. When the browser knows a scroll or touch listener won't block it, interaction handling becomes simpler and more predictable.
CLS fixes should reserve space, not rearrange the page
CLS is often easier to solve than teams expect. Most layout shift problems come from a handful of repeat offenders:
- images without explicit dimensions
- embeds and ads that appear late
- banners inserted above existing content
- dynamic modules that expand after the user starts reading
The verified guidance is clear. Reserve space for ads and embeds with CSS min-height, and set explicit size attributes for images to keep CLS below the accepted threshold. That's the part many teams skip because it feels too basic, but it solves a large share of real-world instability.
High-value CLS fixes that don't hurt LCP
| Problem | Safe fix |
|---|---|
| Images shift content on load | Add explicit width and height attributes |
| Embeds or promos appear late | Reserve space with CSS min-height |
| Variable media blocks resize after fetch | Use aspect-ratio where it fits the component |
| New UI inserts above visible content | Move injection lower or reserve the slot upfront |
For SaaS landing pages with hero visuals, this matters more than teams think. If the hero media changes height after load, the page feels unstable and cheap. But the right fix is usually to predefine the media container, not to delay the asset itself.
The trade-off to watch closely
Many teams over-correct on CLS by deferring visible assets or wrapping everything in placeholders that add complexity without improving perceived speed. That's the wrong instinct for pages that need to rank and convert.
A stable page is good. A stable page that loads slowly is still a bad experience.
That's why every INP or CLS fix should pass one final test. Did it preserve the LCP path? If the answer is no, redesign the fix.
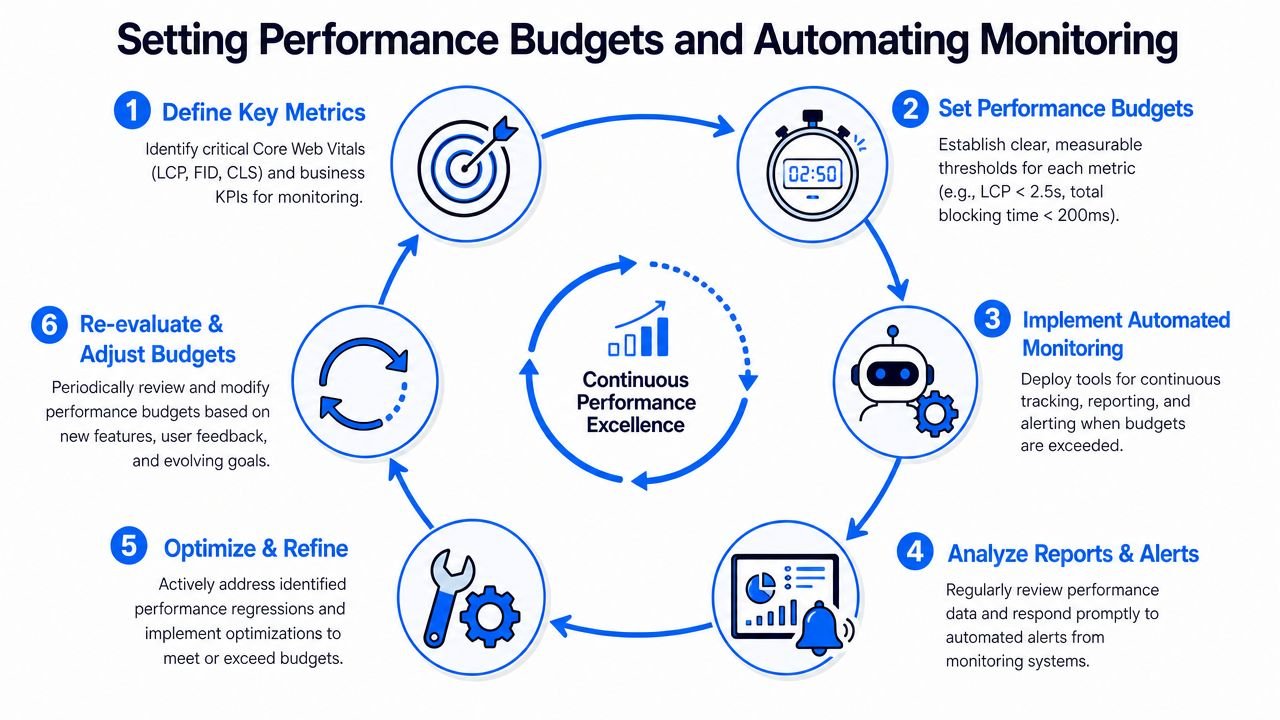
Setting Performance Budgets and Automating Monitoring
Teams that treat performance as a cleanup project end up repeating the same work every quarter. Someone launches a new hero, adds a review widget, installs another analytics script, and the page gradually slips backward. Then the Core Web Vitals report turns red again.
The fix isn't another one-time audit. It's a system.
Performance budgets stop regressions before they ship
A performance budget is just a limit the team agrees not to exceed. It turns “try to keep pages fast” into a real engineering constraint.
The verified guidance gives two strong baseline constraints for that budget: keep total page size under 500KB and resource requests below 50 per page to reduce CPU blocking and support load performance, as noted in the referenced performance best-practices video.
That doesn't mean every page must be identical. A product page and a docs page have different needs. But each template should have clear limits on what can be shipped.
A budget that teams can actually enforce
The best budgets are narrow enough to matter and simple enough to remember.
A workable set often includes:
- LCP target for critical templates
- Maximum JavaScript footprint for initial load
- Maximum number of requests before the page becomes usable
- Protected list of above-the-fold assets that must be prioritized
- Rules for adding third-party tools
What belongs in your CI checks
| Budget item | Why it matters |
|---|---|
| LCP-related asset size | Protects the first impression |
| Initial JS weight | Prevents main-thread overload |
| Request count | Limits network chatter |
| Third-party additions | Stops silent bloat |
| Template-level regressions | Keeps critical pages from drifting |
Automate monitoring or expect drift
Manual checks fail because they happen after the damage is already live. Automated checks catch regressions when a pull request is still easy to fix.
Use a CI workflow with tools such as Lighthouse CI, synthetic performance checks, and alerting tied to key templates. Then pair that with real-user monitoring so you can compare lab regressions against what users feel.
Operating principle: If a change can degrade performance, the team should know before deploy, not after Search Console updates.
This also changes internal behavior. Designers start asking whether a new component needs to load immediately. Engineers challenge third-party scripts earlier. Marketing teams become more selective about what gets added to money pages.
Budgets should reflect business priority
Not every template deserves the same strictness. Put the hardest budgets on the pages closest to revenue:
- homepage
- pricing
- demo request
- signup
- product detail
- category pages with strong search intent
A blog archive can tolerate more weight than a product page. A feature page can tolerate more complexity than a pricing page. That kind of prioritization keeps the process practical and prevents budget fatigue.
Rolling Out Changes and Measuring SEO Impact
Performance work fails politically when teams ship fixes and can't show what changed. The technical work may be correct, but if nobody can connect it to visibility, engagement, or revenue-adjacent signals, the next sprint will go to something louder.
Rollout discipline matters as much as the fix itself.
Release in a way that isolates cause and effect
Avoid bundling major Core Web Vitals changes with unrelated design changes when possible. If you redesign the hero, replace the CMS image pipeline, add a new chat script, and rework the navigation all in one release, nobody can tell which change improved or harmed the result.
Safer rollout patterns include:
- Template-by-template deployment so you can compare similar URLs
- Phased release by page group or market
- Feature flags for high-risk frontend changes
- Annotated analytics timelines so later review isn't guesswork
This is especially important on templates tied closely to organic acquisition. Performance changes can interact with crawl behavior, internal linking, and on-page layout in ways that are hard to untangle after a broad release.
Measure impact with the right lag in mind
Core Web Vitals assessment doesn't refresh instantly. Field data takes time to reflect real traffic, so the team needs patience and documentation.
Use a post-launch review that tracks:
| What to monitor | What it tells you |
|---|---|
| Search Console Core Web Vitals status | Whether affected URLs move toward Good |
| Keyword visibility for fixed templates | Whether rankings improve after stability returns |
| Organic landing-page behavior | Whether users engage differently after fixes |
| Conversion path metrics | Whether improved speed supports key actions |
Search performance rarely changes in a perfectly clean line, so treat this as correlation analysis backed by disciplined rollout timing. If the pages that were failing become eligible for a better page experience profile, and those same templates later show stronger organic behavior, that's a meaningful signal.
A clean internal structure also helps you interpret results. Pages grouped logically by template and intent are easier to audit, deploy, and measure, which is one reason sound site structure for SEO supports performance work better than teams often realize.
What a useful review looks like
The best post-launch reviews answer four questions:
- Which templates changed?
- Which bottleneck was targeted?
- Did field performance improve over time?
- Did business-critical pages show healthier search or conversion behavior?
If you can answer those clearly, performance work stops being “technical maintenance” and becomes visible growth infrastructure.
Sample Playbooks and Key Takeaways
Organizations often don't need more theory. They need a starting sequence for the pages that matter now.
Here are two practical playbooks that work because they respect priority. They start with the element most likely to shape perception, then clean up responsiveness and stability without compromising the fast path.
The SaaS landing page playbook
A SaaS landing page usually wins or loses on the hero and the first interaction.
Start with the hero section. If the largest element is a product screenshot, animation, or video area, make sure HTML arrives quickly, the hero asset is prioritized, and the page doesn't depend on unnecessary client-side rendering before the main content appears. If the hero includes media, reserve its dimensions early so you don't create shift while it loads.
Then move to the form or demo CTA. Watch for INP issues caused by validation, embedded schedulers, or analytics-heavy click handlers. Break long tasks apart and keep the visible response immediate.
A strong SaaS sequence looks like this:
- First fix the hero render path and server response
- Then clean the demo form interaction path
- Finally stabilize banners, testimonials, and media containers that shift after load
The eCommerce product page playbook
A product detail page has a different pressure point. Users care first about the primary product image, price, and variant controls.
So prioritize the main image or first gallery frame. Don't lazy-load the asset users need to evaluate the product. Reserve the gallery dimensions up front so thumbnails, zoom areas, and alternate media don't push the layout around.
Then inspect the variant picker, add-to-cart area, and shipping or inventory widgets for interaction lag. Product pages often suffer when every change triggers too much JavaScript, too many analytics events, or a redraw of unrelated parts of the page.
The order here is usually:
- Protect LCP on the primary product media
- Fix CLS in the gallery, promos, and recommendation slots
- Tighten INP on variant selection and cart actions
Good core web vitals optimization isn't about treating every metric equally. It's about fixing the page in the order users experience it.
The takeaway most teams miss
If you remember one thing, make it this. For SaaS and eCommerce, LCP usually deserves first attention because it controls the moment the page becomes believable. INP and CLS still matter, but they should be solved in ways that preserve that first fast render.
Teams get better results when they stop chasing scores in isolation and start protecting the experience of their highest-intent templates. That's how performance work supports both SEO and conversion goals instead of becoming a detached technical exercise.
If your team wants outside help turning this kind of playbook into an SEO growth system, SaasSky works with SaaS and eCommerce brands on practitioner-led strategies built around accountability, measurable execution, and the pages that drive pipeline and revenue.